

LnRiLWZpZWxke21hcmdpbi1ib3R0b206MC43NmVtfS50Yi1maWVsZC0tbGVmdHt0ZXh0LWFsaWduOmxlZnR9LnRiLWZpZWxkLS1jZW50ZXJ7dGV4dC1hbGlnbjpjZW50ZXJ9LnRiLWZpZWxkLS1yaWdodHt0ZXh0LWFsaWduOnJpZ2h0fS50Yi1maWVsZF9fc2t5cGVfcHJldmlld3twYWRkaW5nOjEwcHggMjBweDtib3JkZXItcmFkaXVzOjNweDtjb2xvcjojZmZmO2JhY2tncm91bmQ6IzAwYWZlZTtkaXNwbGF5OmlubGluZS1ibG9ja311bC5nbGlkZV9fc2xpZGVze21hcmdpbjowfQ==
LnRiLWhlYWRpbmcuaGFzLWJhY2tncm91bmR7cGFkZGluZzowfQ==
Climate Map & Online Tools
A tool that visualizes ongoing research in climate change.
The Climate Map started as an internal team discovery tool to shape our own understanding of the climate change industry and where strategic opportunities exist to participate in or leverage complex interventions. Entries in the climate map are visualized in a network graph, off a relational database, showing the connections and interdependencies for climate projects in three areas:
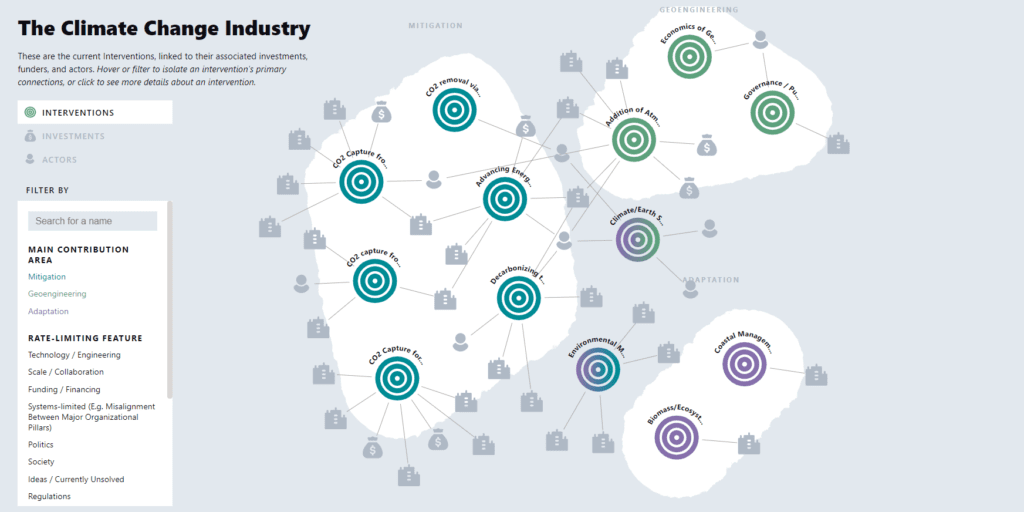
- Mitigation – climate interventions that reduce carbon (primarily) and other greenhouse gas emissions, either through reduction of production of emissions or through innovative techniques for emissions capture.
- Adaptation – climate interventions that take an active role in improving robustness and resiliency of habitats and occupants (humans, animals, plant life, etc.) in the face of climate changes (e.g. sea-level rise) and extreme weather.
- Geoengineering – human-engineered interventions, typically at a global or large ecosystem level (e.g. solar radiation management via introduction of atmospheric aerosols), to control or influence the Earth-climate system with the goal of reducing negative climate change impacts.
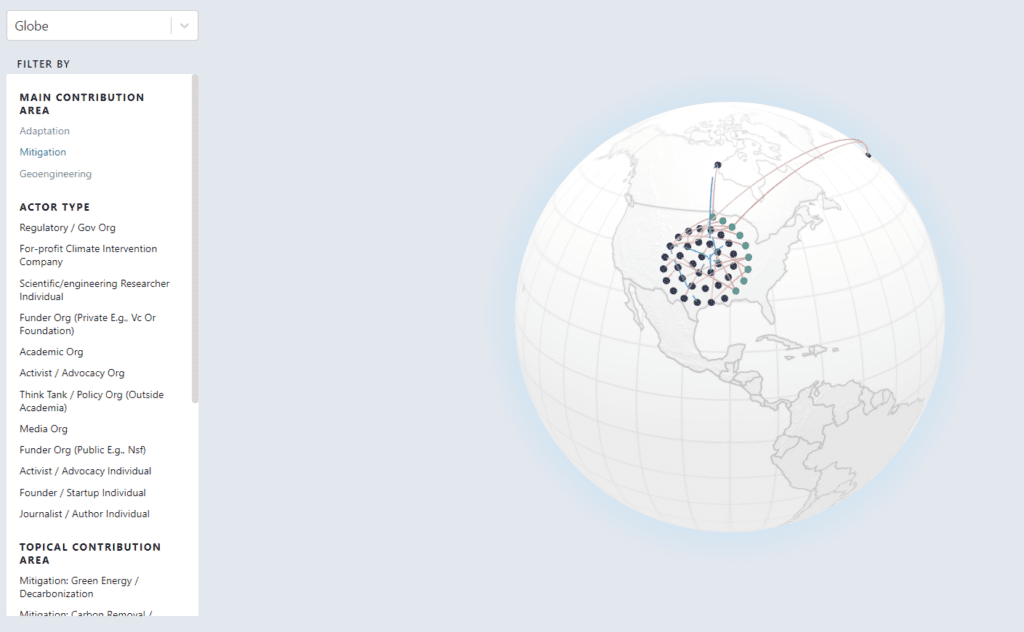
The map shows the actors and organizations that are leading climate change projects in these three areas, how the projects are funded, and how projects and actors relate to one another.


LnRiLWdyaWQsLnRiLWdyaWQ+LmJsb2NrLWVkaXRvci1pbm5lci1ibG9ja3M+LmJsb2NrLWVkaXRvci1ibG9jay1saXN0X19sYXlvdXR7ZGlzcGxheTpncmlkO2dyaWQtcm93LWdhcDoyNXB4O2dyaWQtY29sdW1uLWdhcDoyNXB4fS50Yi1ncmlkLWl0ZW17YmFja2dyb3VuZDojZDM4YTAzO3BhZGRpbmc6MzBweH0udGItZ3JpZC1jb2x1bW57ZmxleC13cmFwOndyYXB9LnRiLWdyaWQtY29sdW1uPip7d2lkdGg6MTAwJX0udGItZ3JpZC1jb2x1bW4udGItZ3JpZC1hbGlnbi10b3B7d2lkdGg6MTAwJTtkaXNwbGF5OmZsZXg7YWxpZ24tY29udGVudDpmbGV4LXN0YXJ0fS50Yi1ncmlkLWNvbHVtbi50Yi1ncmlkLWFsaWduLWNlbnRlcnt3aWR0aDoxMDAlO2Rpc3BsYXk6ZmxleDthbGlnbi1jb250ZW50OmNlbnRlcn0udGItZ3JpZC1jb2x1bW4udGItZ3JpZC1hbGlnbi1ib3R0b217d2lkdGg6MTAwJTtkaXNwbGF5OmZsZXg7YWxpZ24tY29udGVudDpmbGV4LWVuZH0gIC50Yi1ncmlkLC50Yi1ncmlkPi5ibG9jay1lZGl0b3ItaW5uZXItYmxvY2tzPi5ibG9jay1lZGl0b3ItYmxvY2stbGlzdF9fbGF5b3V0e2Rpc3BsYXk6Z3JpZDtncmlkLXJvdy1nYXA6MjVweDtncmlkLWNvbHVtbi1nYXA6MjVweH0udGItZ3JpZC1pdGVte2JhY2tncm91bmQ6I2QzOGEwMztwYWRkaW5nOjMwcHh9LnRiLWdyaWQtY29sdW1ue2ZsZXgtd3JhcDp3cmFwfS50Yi1ncmlkLWNvbHVtbj4qe3dpZHRoOjEwMCV9LnRiLWdyaWQtY29sdW1uLnRiLWdyaWQtYWxpZ24tdG9we3dpZHRoOjEwMCU7ZGlzcGxheTpmbGV4O2FsaWduLWNvbnRlbnQ6ZmxleC1zdGFydH0udGItZ3JpZC1jb2x1bW4udGItZ3JpZC1hbGlnbi1jZW50ZXJ7d2lkdGg6MTAwJTtkaXNwbGF5OmZsZXg7YWxpZ24tY29udGVudDpjZW50ZXJ9LnRiLWdyaWQtY29sdW1uLnRiLWdyaWQtYWxpZ24tYm90dG9te3dpZHRoOjEwMCU7ZGlzcGxheTpmbGV4O2FsaWduLWNvbnRlbnQ6ZmxleC1lbmR9IC53cHYtdmlldy1vdXRwdXRbZGF0YS10b29sc2V0LXZpZXdzLXZpZXctZWRpdG9yPSJkNDhlYjVjYTk5NDg2NDE1MjFlYjE3NjliODgyNTZiNSJdID4gLnRiLWdyaWQtY29sdW1uOm50aC1vZi10eXBlKDVuICsgMSkgeyBncmlkLWNvbHVtbjogMSB9IC53cHYtdmlldy1vdXRwdXRbZGF0YS10b29sc2V0LXZpZXdzLXZpZXctZWRpdG9yPSJkNDhlYjVjYTk5NDg2NDE1MjFlYjE3NjliODgyNTZiNSJdID4gLnRiLWdyaWQtY29sdW1uOm50aC1vZi10eXBlKDVuICsgMikgeyBncmlkLWNvbHVtbjogMiB9IC53cHYtdmlldy1vdXRwdXRbZGF0YS10b29sc2V0LXZpZXdzLXZpZXctZWRpdG9yPSJkNDhlYjVjYTk5NDg2NDE1MjFlYjE3NjliODgyNTZiNSJdID4gLnRiLWdyaWQtY29sdW1uOm50aC1vZi10eXBlKDVuICsgMykgeyBncmlkLWNvbHVtbjogMyB9IC53cHYtdmlldy1vdXRwdXRbZGF0YS10b29sc2V0LXZpZXdzLXZpZXctZWRpdG9yPSJkNDhlYjVjYTk5NDg2NDE1MjFlYjE3NjliODgyNTZiNSJdID4gLnRiLWdyaWQtY29sdW1uOm50aC1vZi10eXBlKDVuICsgNCkgeyBncmlkLWNvbHVtbjogNCB9IC53cHYtdmlldy1vdXRwdXRbZGF0YS10b29sc2V0LXZpZXdzLXZpZXctZWRpdG9yPSJkNDhlYjVjYTk5NDg2NDE1MjFlYjE3NjliODgyNTZiNSJdID4gLnRiLWdyaWQtY29sdW1uOm50aC1vZi10eXBlKDVuICsgNSkgeyBncmlkLWNvbHVtbjogNSB9IC53cHYtdmlldy1vdXRwdXRbZGF0YS10b29sc2V0LXZpZXdzLXZpZXctZWRpdG9yPSJkNDhlYjVjYTk5NDg2NDE1MjFlYjE3NjliODgyNTZiNSJdIC5qcy13cHYtbG9vcC13cmFwcGVyID4gLnRiLWdyaWQgeyBncmlkLXRlbXBsYXRlLWNvbHVtbnM6IG1pbm1heCgwLCAwLjJmcikgbWlubWF4KDAsIDAuMmZyKSBtaW5tYXgoMCwgMC4yZnIpIG1pbm1heCgwLCAwLjJmcikgbWlubWF4KDAsIDAuMmZyKTtncmlkLWF1dG8tZmxvdzogcm93IH0gLnRiLWZpZWxkW2RhdGEtdG9vbHNldC1ibG9ja3MtZmllbGQ9IjU1M2M5ODUyMDI2NTlkYmZkZDJjZDQ3Zjg5ZWM0MTljIl0geyBtYXJnaW4tdG9wOiAxNXB4OyB9ICAudGItaW1hZ2V7cG9zaXRpb246cmVsYXRpdmU7dHJhbnNpdGlvbjp0cmFuc2Zvcm0gMC4yNXMgZWFzZX0ud3AtYmxvY2staW1hZ2UgLnRiLWltYWdlLmFsaWduY2VudGVye21hcmdpbi1sZWZ0OmF1dG87bWFyZ2luLXJpZ2h0OmF1dG99LnRiLWltYWdlIGltZ3ttYXgtd2lkdGg6MTAwJTtoZWlnaHQ6YXV0bzt3aWR0aDphdXRvO3RyYW5zaXRpb246dHJhbnNmb3JtIDAuMjVzIGVhc2V9LnRiLWltYWdlIC50Yi1pbWFnZS1jYXB0aW9uLWZpdC10by1pbWFnZXtkaXNwbGF5OnRhYmxlfS50Yi1pbWFnZSAudGItaW1hZ2UtY2FwdGlvbi1maXQtdG8taW1hZ2UgLnRiLWltYWdlLWNhcHRpb257ZGlzcGxheTp0YWJsZS1jYXB0aW9uO2NhcHRpb24tc2lkZTpib3R0b219IC53cC1ibG9jay1pbWFnZS50Yi1pbWFnZVtkYXRhLXRvb2xzZXQtYmxvY2tzLWltYWdlPSIzYmNkYmRlNDIwZmU4OGZmNmYyNjA3ZjU5OTQ5OTU5YSJdIHsgbWF4LXdpZHRoOiAxMDAlOyB9IC53cC1ibG9jay1pbWFnZS50Yi1pbWFnZVtkYXRhLXRvb2xzZXQtYmxvY2tzLWltYWdlPSIzYmNkYmRlNDIwZmU4OGZmNmYyNjA3ZjU5OTQ5OTU5YSJdIGltZyB7IGJvcmRlcjogMXB4IHNvbGlkIHJnYmEoIDAsIDAsIDAsIDEgKTsgfSAgaDMudGItaGVhZGluZ1tkYXRhLXRvb2xzZXQtYmxvY2tzLWhlYWRpbmc9ImM5OGFlZDk1ZGMzOGQyMDJkYmZiNDk4MWQ3ODI4MGE0Il0gIHsgdGV4dC1hbGlnbjogbGVmdDsgfSAgQG1lZGlhIG9ubHkgc2NyZWVuIGFuZCAobWF4LXdpZHRoOiA3ODFweCkgeyAudGItZ3JpZCwudGItZ3JpZD4uYmxvY2stZWRpdG9yLWlubmVyLWJsb2Nrcz4uYmxvY2stZWRpdG9yLWJsb2NrLWxpc3RfX2xheW91dHtkaXNwbGF5OmdyaWQ7Z3JpZC1yb3ctZ2FwOjI1cHg7Z3JpZC1jb2x1bW4tZ2FwOjI1cHh9LnRiLWdyaWQtaXRlbXtiYWNrZ3JvdW5kOiNkMzhhMDM7cGFkZGluZzozMHB4fS50Yi1ncmlkLWNvbHVtbntmbGV4LXdyYXA6d3JhcH0udGItZ3JpZC1jb2x1bW4+Knt3aWR0aDoxMDAlfS50Yi1ncmlkLWNvbHVtbi50Yi1ncmlkLWFsaWduLXRvcHt3aWR0aDoxMDAlO2Rpc3BsYXk6ZmxleDthbGlnbi1jb250ZW50OmZsZXgtc3RhcnR9LnRiLWdyaWQtY29sdW1uLnRiLWdyaWQtYWxpZ24tY2VudGVye3dpZHRoOjEwMCU7ZGlzcGxheTpmbGV4O2FsaWduLWNvbnRlbnQ6Y2VudGVyfS50Yi1ncmlkLWNvbHVtbi50Yi1ncmlkLWFsaWduLWJvdHRvbXt3aWR0aDoxMDAlO2Rpc3BsYXk6ZmxleDthbGlnbi1jb250ZW50OmZsZXgtZW5kfSAgLnRiLWdyaWQsLnRiLWdyaWQ+LmJsb2NrLWVkaXRvci1pbm5lci1ibG9ja3M+LmJsb2NrLWVkaXRvci1ibG9jay1saXN0X19sYXlvdXR7ZGlzcGxheTpncmlkO2dyaWQtcm93LWdhcDoyNXB4O2dyaWQtY29sdW1uLWdhcDoyNXB4fS50Yi1ncmlkLWl0ZW17YmFja2dyb3VuZDojZDM4YTAzO3BhZGRpbmc6MzBweH0udGItZ3JpZC1jb2x1bW57ZmxleC13cmFwOndyYXB9LnRiLWdyaWQtY29sdW1uPip7d2lkdGg6MTAwJX0udGItZ3JpZC1jb2x1bW4udGItZ3JpZC1hbGlnbi10b3B7d2lkdGg6MTAwJTtkaXNwbGF5OmZsZXg7YWxpZ24tY29udGVudDpmbGV4LXN0YXJ0fS50Yi1ncmlkLWNvbHVtbi50Yi1ncmlkLWFsaWduLWNlbnRlcnt3aWR0aDoxMDAlO2Rpc3BsYXk6ZmxleDthbGlnbi1jb250ZW50OmNlbnRlcn0udGItZ3JpZC1jb2x1bW4udGItZ3JpZC1hbGlnbi1ib3R0b217d2lkdGg6MTAwJTtkaXNwbGF5OmZsZXg7YWxpZ24tY29udGVudDpmbGV4LWVuZH0gLndwdi12aWV3LW91dHB1dFtkYXRhLXRvb2xzZXQtdmlld3Mtdmlldy1lZGl0b3I9ImQ0OGViNWNhOTk0ODY0MTUyMWViMTc2OWI4ODI1NmI1Il0gPiAudGItZ3JpZC1jb2x1bW46bnRoLW9mLXR5cGUoM24gKyAxKSB7IGdyaWQtY29sdW1uOiAxIH0gLndwdi12aWV3LW91dHB1dFtkYXRhLXRvb2xzZXQtdmlld3Mtdmlldy1lZGl0b3I9ImQ0OGViNWNhOTk0ODY0MTUyMWViMTc2OWI4ODI1NmI1Il0gPiAudGItZ3JpZC1jb2x1bW46bnRoLW9mLXR5cGUoM24gKyAyKSB7IGdyaWQtY29sdW1uOiAyIH0gLndwdi12aWV3LW91dHB1dFtkYXRhLXRvb2xzZXQtdmlld3Mtdmlldy1lZGl0b3I9ImQ0OGViNWNhOTk0ODY0MTUyMWViMTc2OWI4ODI1NmI1Il0gPiAudGItZ3JpZC1jb2x1bW46bnRoLW9mLXR5cGUoM24gKyAzKSB7IGdyaWQtY29sdW1uOiAzIH0gLndwdi12aWV3LW91dHB1dFtkYXRhLXRvb2xzZXQtdmlld3Mtdmlldy1lZGl0b3I9ImQ0OGViNWNhOTk0ODY0MTUyMWViMTc2OWI4ODI1NmI1Il0gLmpzLXdwdi1sb29wLXdyYXBwZXIgPiAudGItZ3JpZCB7IGdyaWQtdGVtcGxhdGUtY29sdW1uczogbWlubWF4KDAsIDAuMzMzM2ZyKSBtaW5tYXgoMCwgMC4zMzMzZnIpIG1pbm1heCgwLCAwLjMzMzNmcik7Z3JpZC1hdXRvLWZsb3c6IHJvdyB9ICAudGItaW1hZ2V7cG9zaXRpb246cmVsYXRpdmU7dHJhbnNpdGlvbjp0cmFuc2Zvcm0gMC4yNXMgZWFzZX0ud3AtYmxvY2staW1hZ2UgLnRiLWltYWdlLmFsaWduY2VudGVye21hcmdpbi1sZWZ0OmF1dG87bWFyZ2luLXJpZ2h0OmF1dG99LnRiLWltYWdlIGltZ3ttYXgtd2lkdGg6MTAwJTtoZWlnaHQ6YXV0bzt3aWR0aDphdXRvO3RyYW5zaXRpb246dHJhbnNmb3JtIDAuMjVzIGVhc2V9LnRiLWltYWdlIC50Yi1pbWFnZS1jYXB0aW9uLWZpdC10by1pbWFnZXtkaXNwbGF5OnRhYmxlfS50Yi1pbWFnZSAudGItaW1hZ2UtY2FwdGlvbi1maXQtdG8taW1hZ2UgLnRiLWltYWdlLWNhcHRpb257ZGlzcGxheTp0YWJsZS1jYXB0aW9uO2NhcHRpb24tc2lkZTpib3R0b219ICAgfSBAbWVkaWEgb25seSBzY3JlZW4gYW5kIChtYXgtd2lkdGg6IDU5OXB4KSB7IC50Yi1ncmlkLC50Yi1ncmlkPi5ibG9jay1lZGl0b3ItaW5uZXItYmxvY2tzPi5ibG9jay1lZGl0b3ItYmxvY2stbGlzdF9fbGF5b3V0e2Rpc3BsYXk6Z3JpZDtncmlkLXJvdy1nYXA6MjVweDtncmlkLWNvbHVtbi1nYXA6MjVweH0udGItZ3JpZC1pdGVte2JhY2tncm91bmQ6I2QzOGEwMztwYWRkaW5nOjMwcHh9LnRiLWdyaWQtY29sdW1ue2ZsZXgtd3JhcDp3cmFwfS50Yi1ncmlkLWNvbHVtbj4qe3dpZHRoOjEwMCV9LnRiLWdyaWQtY29sdW1uLnRiLWdyaWQtYWxpZ24tdG9we3dpZHRoOjEwMCU7ZGlzcGxheTpmbGV4O2FsaWduLWNvbnRlbnQ6ZmxleC1zdGFydH0udGItZ3JpZC1jb2x1bW4udGItZ3JpZC1hbGlnbi1jZW50ZXJ7d2lkdGg6MTAwJTtkaXNwbGF5OmZsZXg7YWxpZ24tY29udGVudDpjZW50ZXJ9LnRiLWdyaWQtY29sdW1uLnRiLWdyaWQtYWxpZ24tYm90dG9te3dpZHRoOjEwMCU7ZGlzcGxheTpmbGV4O2FsaWduLWNvbnRlbnQ6ZmxleC1lbmR9ICAudGItZ3JpZCwudGItZ3JpZD4uYmxvY2stZWRpdG9yLWlubmVyLWJsb2Nrcz4uYmxvY2stZWRpdG9yLWJsb2NrLWxpc3RfX2xheW91dHtkaXNwbGF5OmdyaWQ7Z3JpZC1yb3ctZ2FwOjI1cHg7Z3JpZC1jb2x1bW4tZ2FwOjI1cHh9LnRiLWdyaWQtaXRlbXtiYWNrZ3JvdW5kOiNkMzhhMDM7cGFkZGluZzozMHB4fS50Yi1ncmlkLWNvbHVtbntmbGV4LXdyYXA6d3JhcH0udGItZ3JpZC1jb2x1bW4+Knt3aWR0aDoxMDAlfS50Yi1ncmlkLWNvbHVtbi50Yi1ncmlkLWFsaWduLXRvcHt3aWR0aDoxMDAlO2Rpc3BsYXk6ZmxleDthbGlnbi1jb250ZW50OmZsZXgtc3RhcnR9LnRiLWdyaWQtY29sdW1uLnRiLWdyaWQtYWxpZ24tY2VudGVye3dpZHRoOjEwMCU7ZGlzcGxheTpmbGV4O2FsaWduLWNvbnRlbnQ6Y2VudGVyfS50Yi1ncmlkLWNvbHVtbi50Yi1ncmlkLWFsaWduLWJvdHRvbXt3aWR0aDoxMDAlO2Rpc3BsYXk6ZmxleDthbGlnbi1jb250ZW50OmZsZXgtZW5kfSAud3B2LXZpZXctb3V0cHV0W2RhdGEtdG9vbHNldC12aWV3cy12aWV3LWVkaXRvcj0iZDQ4ZWI1Y2E5OTQ4NjQxNTIxZWIxNzY5Yjg4MjU2YjUiXSAgPiAudGItZ3JpZC1jb2x1bW46bnRoLW9mLXR5cGUoMW4rMSkgeyBncmlkLWNvbHVtbjogMSB9IC53cHYtdmlldy1vdXRwdXRbZGF0YS10b29sc2V0LXZpZXdzLXZpZXctZWRpdG9yPSJkNDhlYjVjYTk5NDg2NDE1MjFlYjE3NjliODgyNTZiNSJdIC5qcy13cHYtbG9vcC13cmFwcGVyID4gLnRiLWdyaWQgeyBncmlkLXRlbXBsYXRlLWNvbHVtbnM6IG1pbm1heCgwLCAxZnIpO2dyaWQtYXV0by1mbG93OiByb3cgfSAgLnRiLWltYWdle3Bvc2l0aW9uOnJlbGF0aXZlO3RyYW5zaXRpb246dHJhbnNmb3JtIDAuMjVzIGVhc2V9LndwLWJsb2NrLWltYWdlIC50Yi1pbWFnZS5hbGlnbmNlbnRlcnttYXJnaW4tbGVmdDphdXRvO21hcmdpbi1yaWdodDphdXRvfS50Yi1pbWFnZSBpbWd7bWF4LXdpZHRoOjEwMCU7aGVpZ2h0OmF1dG87d2lkdGg6YXV0bzt0cmFuc2l0aW9uOnRyYW5zZm9ybSAwLjI1cyBlYXNlfS50Yi1pbWFnZSAudGItaW1hZ2UtY2FwdGlvbi1maXQtdG8taW1hZ2V7ZGlzcGxheTp0YWJsZX0udGItaW1hZ2UgLnRiLWltYWdlLWNhcHRpb24tZml0LXRvLWltYWdlIC50Yi1pbWFnZS1jYXB0aW9ue2Rpc3BsYXk6dGFibGUtY2FwdGlvbjtjYXB0aW9uLXNpZGU6Ym90dG9tfSAgIH0g
Collaborators on this project include Amelia Wattenberger, Rocky Mitsuhashi, and Debbie Altomonte.

Resources
LnRiLWdyaWQsLnRiLWdyaWQ+LmJsb2NrLWVkaXRvci1pbm5lci1ibG9ja3M+LmJsb2NrLWVkaXRvci1ibG9jay1saXN0X19sYXlvdXR7ZGlzcGxheTpncmlkO2dyaWQtcm93LWdhcDoyNXB4O2dyaWQtY29sdW1uLWdhcDoyNXB4fS50Yi1ncmlkLWl0ZW17YmFja2dyb3VuZDojZDM4YTAzO3BhZGRpbmc6MzBweH0udGItZ3JpZC1jb2x1bW57ZmxleC13cmFwOndyYXB9LnRiLWdyaWQtY29sdW1uPip7d2lkdGg6MTAwJX0udGItZ3JpZC1jb2x1bW4udGItZ3JpZC1hbGlnbi10b3B7d2lkdGg6MTAwJTtkaXNwbGF5OmZsZXg7YWxpZ24tY29udGVudDpmbGV4LXN0YXJ0fS50Yi1ncmlkLWNvbHVtbi50Yi1ncmlkLWFsaWduLWNlbnRlcnt3aWR0aDoxMDAlO2Rpc3BsYXk6ZmxleDthbGlnbi1jb250ZW50OmNlbnRlcn0udGItZ3JpZC1jb2x1bW4udGItZ3JpZC1hbGlnbi1ib3R0b217d2lkdGg6MTAwJTtkaXNwbGF5OmZsZXg7YWxpZ24tY29udGVudDpmbGV4LWVuZH0gIC50Yi1ncmlkLC50Yi1ncmlkPi5ibG9jay1lZGl0b3ItaW5uZXItYmxvY2tzPi5ibG9jay1lZGl0b3ItYmxvY2stbGlzdF9fbGF5b3V0e2Rpc3BsYXk6Z3JpZDtncmlkLXJvdy1nYXA6MjVweDtncmlkLWNvbHVtbi1nYXA6MjVweH0udGItZ3JpZC1pdGVte2JhY2tncm91bmQ6I2QzOGEwMztwYWRkaW5nOjMwcHh9LnRiLWdyaWQtY29sdW1ue2ZsZXgtd3JhcDp3cmFwfS50Yi1ncmlkLWNvbHVtbj4qe3dpZHRoOjEwMCV9LnRiLWdyaWQtY29sdW1uLnRiLWdyaWQtYWxpZ24tdG9we3dpZHRoOjEwMCU7ZGlzcGxheTpmbGV4O2FsaWduLWNvbnRlbnQ6ZmxleC1zdGFydH0udGItZ3JpZC1jb2x1bW4udGItZ3JpZC1hbGlnbi1jZW50ZXJ7d2lkdGg6MTAwJTtkaXNwbGF5OmZsZXg7YWxpZ24tY29udGVudDpjZW50ZXJ9LnRiLWdyaWQtY29sdW1uLnRiLWdyaWQtYWxpZ24tYm90dG9te3dpZHRoOjEwMCU7ZGlzcGxheTpmbGV4O2FsaWduLWNvbnRlbnQ6ZmxleC1lbmR9IC53cHYtdmlldy1vdXRwdXRbZGF0YS10b29sc2V0LXZpZXdzLXZpZXctZWRpdG9yPSJkNDhlYjVjYTk5NDg2NDE1MjFlYjE3NjliODgyNTZiNSJdID4gLnRiLWdyaWQtY29sdW1uOm50aC1vZi10eXBlKDVuICsgMSkgeyBncmlkLWNvbHVtbjogMSB9IC53cHYtdmlldy1vdXRwdXRbZGF0YS10b29sc2V0LXZpZXdzLXZpZXctZWRpdG9yPSJkNDhlYjVjYTk5NDg2NDE1MjFlYjE3NjliODgyNTZiNSJdID4gLnRiLWdyaWQtY29sdW1uOm50aC1vZi10eXBlKDVuICsgMikgeyBncmlkLWNvbHVtbjogMiB9IC53cHYtdmlldy1vdXRwdXRbZGF0YS10b29sc2V0LXZpZXdzLXZpZXctZWRpdG9yPSJkNDhlYjVjYTk5NDg2NDE1MjFlYjE3NjliODgyNTZiNSJdID4gLnRiLWdyaWQtY29sdW1uOm50aC1vZi10eXBlKDVuICsgMykgeyBncmlkLWNvbHVtbjogMyB9IC53cHYtdmlldy1vdXRwdXRbZGF0YS10b29sc2V0LXZpZXdzLXZpZXctZWRpdG9yPSJkNDhlYjVjYTk5NDg2NDE1MjFlYjE3NjliODgyNTZiNSJdID4gLnRiLWdyaWQtY29sdW1uOm50aC1vZi10eXBlKDVuICsgNCkgeyBncmlkLWNvbHVtbjogNCB9IC53cHYtdmlldy1vdXRwdXRbZGF0YS10b29sc2V0LXZpZXdzLXZpZXctZWRpdG9yPSJkNDhlYjVjYTk5NDg2NDE1MjFlYjE3NjliODgyNTZiNSJdID4gLnRiLWdyaWQtY29sdW1uOm50aC1vZi10eXBlKDVuICsgNSkgeyBncmlkLWNvbHVtbjogNSB9IC53cHYtdmlldy1vdXRwdXRbZGF0YS10b29sc2V0LXZpZXdzLXZpZXctZWRpdG9yPSJkNDhlYjVjYTk5NDg2NDE1MjFlYjE3NjliODgyNTZiNSJdIC5qcy13cHYtbG9vcC13cmFwcGVyID4gLnRiLWdyaWQgeyBncmlkLXRlbXBsYXRlLWNvbHVtbnM6IG1pbm1heCgwLCAwLjJmcikgbWlubWF4KDAsIDAuMmZyKSBtaW5tYXgoMCwgMC4yZnIpIG1pbm1heCgwLCAwLjJmcikgbWlubWF4KDAsIDAuMmZyKTtncmlkLWF1dG8tZmxvdzogcm93IH0gLnRiLWZpZWxkW2RhdGEtdG9vbHNldC1ibG9ja3MtZmllbGQ9IjU1M2M5ODUyMDI2NTlkYmZkZDJjZDQ3Zjg5ZWM0MTljIl0geyBtYXJnaW4tdG9wOiAxNXB4OyB9ICAudGItaW1hZ2V7cG9zaXRpb246cmVsYXRpdmU7dHJhbnNpdGlvbjp0cmFuc2Zvcm0gMC4yNXMgZWFzZX0ud3AtYmxvY2staW1hZ2UgLnRiLWltYWdlLmFsaWduY2VudGVye21hcmdpbi1sZWZ0OmF1dG87bWFyZ2luLXJpZ2h0OmF1dG99LnRiLWltYWdlIGltZ3ttYXgtd2lkdGg6MTAwJTtoZWlnaHQ6YXV0bzt3aWR0aDphdXRvO3RyYW5zaXRpb246dHJhbnNmb3JtIDAuMjVzIGVhc2V9LnRiLWltYWdlIC50Yi1pbWFnZS1jYXB0aW9uLWZpdC10by1pbWFnZXtkaXNwbGF5OnRhYmxlfS50Yi1pbWFnZSAudGItaW1hZ2UtY2FwdGlvbi1maXQtdG8taW1hZ2UgLnRiLWltYWdlLWNhcHRpb257ZGlzcGxheTp0YWJsZS1jYXB0aW9uO2NhcHRpb24tc2lkZTpib3R0b219IC53cC1ibG9jay1pbWFnZS50Yi1pbWFnZVtkYXRhLXRvb2xzZXQtYmxvY2tzLWltYWdlPSIzYmNkYmRlNDIwZmU4OGZmNmYyNjA3ZjU5OTQ5OTU5YSJdIHsgbWF4LXdpZHRoOiAxMDAlOyB9IC53cC1ibG9jay1pbWFnZS50Yi1pbWFnZVtkYXRhLXRvb2xzZXQtYmxvY2tzLWltYWdlPSIzYmNkYmRlNDIwZmU4OGZmNmYyNjA3ZjU5OTQ5OTU5YSJdIGltZyB7IGJvcmRlcjogMXB4IHNvbGlkIHJnYmEoIDAsIDAsIDAsIDEgKTsgfSAgaDMudGItaGVhZGluZ1tkYXRhLXRvb2xzZXQtYmxvY2tzLWhlYWRpbmc9ImM5OGFlZDk1ZGMzOGQyMDJkYmZiNDk4MWQ3ODI4MGE0Il0gIHsgdGV4dC1hbGlnbjogbGVmdDsgfSAgQG1lZGlhIG9ubHkgc2NyZWVuIGFuZCAobWF4LXdpZHRoOiA3ODFweCkgeyAudGItZ3JpZCwudGItZ3JpZD4uYmxvY2stZWRpdG9yLWlubmVyLWJsb2Nrcz4uYmxvY2stZWRpdG9yLWJsb2NrLWxpc3RfX2xheW91dHtkaXNwbGF5OmdyaWQ7Z3JpZC1yb3ctZ2FwOjI1cHg7Z3JpZC1jb2x1bW4tZ2FwOjI1cHh9LnRiLWdyaWQtaXRlbXtiYWNrZ3JvdW5kOiNkMzhhMDM7cGFkZGluZzozMHB4fS50Yi1ncmlkLWNvbHVtbntmbGV4LXdyYXA6d3JhcH0udGItZ3JpZC1jb2x1bW4+Knt3aWR0aDoxMDAlfS50Yi1ncmlkLWNvbHVtbi50Yi1ncmlkLWFsaWduLXRvcHt3aWR0aDoxMDAlO2Rpc3BsYXk6ZmxleDthbGlnbi1jb250ZW50OmZsZXgtc3RhcnR9LnRiLWdyaWQtY29sdW1uLnRiLWdyaWQtYWxpZ24tY2VudGVye3dpZHRoOjEwMCU7ZGlzcGxheTpmbGV4O2FsaWduLWNvbnRlbnQ6Y2VudGVyfS50Yi1ncmlkLWNvbHVtbi50Yi1ncmlkLWFsaWduLWJvdHRvbXt3aWR0aDoxMDAlO2Rpc3BsYXk6ZmxleDthbGlnbi1jb250ZW50OmZsZXgtZW5kfSAgLnRiLWdyaWQsLnRiLWdyaWQ+LmJsb2NrLWVkaXRvci1pbm5lci1ibG9ja3M+LmJsb2NrLWVkaXRvci1ibG9jay1saXN0X19sYXlvdXR7ZGlzcGxheTpncmlkO2dyaWQtcm93LWdhcDoyNXB4O2dyaWQtY29sdW1uLWdhcDoyNXB4fS50Yi1ncmlkLWl0ZW17YmFja2dyb3VuZDojZDM4YTAzO3BhZGRpbmc6MzBweH0udGItZ3JpZC1jb2x1bW57ZmxleC13cmFwOndyYXB9LnRiLWdyaWQtY29sdW1uPip7d2lkdGg6MTAwJX0udGItZ3JpZC1jb2x1bW4udGItZ3JpZC1hbGlnbi10b3B7d2lkdGg6MTAwJTtkaXNwbGF5OmZsZXg7YWxpZ24tY29udGVudDpmbGV4LXN0YXJ0fS50Yi1ncmlkLWNvbHVtbi50Yi1ncmlkLWFsaWduLWNlbnRlcnt3aWR0aDoxMDAlO2Rpc3BsYXk6ZmxleDthbGlnbi1jb250ZW50OmNlbnRlcn0udGItZ3JpZC1jb2x1bW4udGItZ3JpZC1hbGlnbi1ib3R0b217d2lkdGg6MTAwJTtkaXNwbGF5OmZsZXg7YWxpZ24tY29udGVudDpmbGV4LWVuZH0gLndwdi12aWV3LW91dHB1dFtkYXRhLXRvb2xzZXQtdmlld3Mtdmlldy1lZGl0b3I9ImQ0OGViNWNhOTk0ODY0MTUyMWViMTc2OWI4ODI1NmI1Il0gPiAudGItZ3JpZC1jb2x1bW46bnRoLW9mLXR5cGUoM24gKyAxKSB7IGdyaWQtY29sdW1uOiAxIH0gLndwdi12aWV3LW91dHB1dFtkYXRhLXRvb2xzZXQtdmlld3Mtdmlldy1lZGl0b3I9ImQ0OGViNWNhOTk0ODY0MTUyMWViMTc2OWI4ODI1NmI1Il0gPiAudGItZ3JpZC1jb2x1bW46bnRoLW9mLXR5cGUoM24gKyAyKSB7IGdyaWQtY29sdW1uOiAyIH0gLndwdi12aWV3LW91dHB1dFtkYXRhLXRvb2xzZXQtdmlld3Mtdmlldy1lZGl0b3I9ImQ0OGViNWNhOTk0ODY0MTUyMWViMTc2OWI4ODI1NmI1Il0gPiAudGItZ3JpZC1jb2x1bW46bnRoLW9mLXR5cGUoM24gKyAzKSB7IGdyaWQtY29sdW1uOiAzIH0gLndwdi12aWV3LW91dHB1dFtkYXRhLXRvb2xzZXQtdmlld3Mtdmlldy1lZGl0b3I9ImQ0OGViNWNhOTk0ODY0MTUyMWViMTc2OWI4ODI1NmI1Il0gLmpzLXdwdi1sb29wLXdyYXBwZXIgPiAudGItZ3JpZCB7IGdyaWQtdGVtcGxhdGUtY29sdW1uczogbWlubWF4KDAsIDAuMzMzM2ZyKSBtaW5tYXgoMCwgMC4zMzMzZnIpIG1pbm1heCgwLCAwLjMzMzNmcik7Z3JpZC1hdXRvLWZsb3c6IHJvdyB9ICAudGItaW1hZ2V7cG9zaXRpb246cmVsYXRpdmU7dHJhbnNpdGlvbjp0cmFuc2Zvcm0gMC4yNXMgZWFzZX0ud3AtYmxvY2staW1hZ2UgLnRiLWltYWdlLmFsaWduY2VudGVye21hcmdpbi1sZWZ0OmF1dG87bWFyZ2luLXJpZ2h0OmF1dG99LnRiLWltYWdlIGltZ3ttYXgtd2lkdGg6MTAwJTtoZWlnaHQ6YXV0bzt3aWR0aDphdXRvO3RyYW5zaXRpb246dHJhbnNmb3JtIDAuMjVzIGVhc2V9LnRiLWltYWdlIC50Yi1pbWFnZS1jYXB0aW9uLWZpdC10by1pbWFnZXtkaXNwbGF5OnRhYmxlfS50Yi1pbWFnZSAudGItaW1hZ2UtY2FwdGlvbi1maXQtdG8taW1hZ2UgLnRiLWltYWdlLWNhcHRpb257ZGlzcGxheTp0YWJsZS1jYXB0aW9uO2NhcHRpb24tc2lkZTpib3R0b219ICAgfSBAbWVkaWEgb25seSBzY3JlZW4gYW5kIChtYXgtd2lkdGg6IDU5OXB4KSB7IC50Yi1ncmlkLC50Yi1ncmlkPi5ibG9jay1lZGl0b3ItaW5uZXItYmxvY2tzPi5ibG9jay1lZGl0b3ItYmxvY2stbGlzdF9fbGF5b3V0e2Rpc3BsYXk6Z3JpZDtncmlkLXJvdy1nYXA6MjVweDtncmlkLWNvbHVtbi1nYXA6MjVweH0udGItZ3JpZC1pdGVte2JhY2tncm91bmQ6I2QzOGEwMztwYWRkaW5nOjMwcHh9LnRiLWdyaWQtY29sdW1ue2ZsZXgtd3JhcDp3cmFwfS50Yi1ncmlkLWNvbHVtbj4qe3dpZHRoOjEwMCV9LnRiLWdyaWQtY29sdW1uLnRiLWdyaWQtYWxpZ24tdG9we3dpZHRoOjEwMCU7ZGlzcGxheTpmbGV4O2FsaWduLWNvbnRlbnQ6ZmxleC1zdGFydH0udGItZ3JpZC1jb2x1bW4udGItZ3JpZC1hbGlnbi1jZW50ZXJ7d2lkdGg6MTAwJTtkaXNwbGF5OmZsZXg7YWxpZ24tY29udGVudDpjZW50ZXJ9LnRiLWdyaWQtY29sdW1uLnRiLWdyaWQtYWxpZ24tYm90dG9te3dpZHRoOjEwMCU7ZGlzcGxheTpmbGV4O2FsaWduLWNvbnRlbnQ6ZmxleC1lbmR9ICAudGItZ3JpZCwudGItZ3JpZD4uYmxvY2stZWRpdG9yLWlubmVyLWJsb2Nrcz4uYmxvY2stZWRpdG9yLWJsb2NrLWxpc3RfX2xheW91dHtkaXNwbGF5OmdyaWQ7Z3JpZC1yb3ctZ2FwOjI1cHg7Z3JpZC1jb2x1bW4tZ2FwOjI1cHh9LnRiLWdyaWQtaXRlbXtiYWNrZ3JvdW5kOiNkMzhhMDM7cGFkZGluZzozMHB4fS50Yi1ncmlkLWNvbHVtbntmbGV4LXdyYXA6d3JhcH0udGItZ3JpZC1jb2x1bW4+Knt3aWR0aDoxMDAlfS50Yi1ncmlkLWNvbHVtbi50Yi1ncmlkLWFsaWduLXRvcHt3aWR0aDoxMDAlO2Rpc3BsYXk6ZmxleDthbGlnbi1jb250ZW50OmZsZXgtc3RhcnR9LnRiLWdyaWQtY29sdW1uLnRiLWdyaWQtYWxpZ24tY2VudGVye3dpZHRoOjEwMCU7ZGlzcGxheTpmbGV4O2FsaWduLWNvbnRlbnQ6Y2VudGVyfS50Yi1ncmlkLWNvbHVtbi50Yi1ncmlkLWFsaWduLWJvdHRvbXt3aWR0aDoxMDAlO2Rpc3BsYXk6ZmxleDthbGlnbi1jb250ZW50OmZsZXgtZW5kfSAud3B2LXZpZXctb3V0cHV0W2RhdGEtdG9vbHNldC12aWV3cy12aWV3LWVkaXRvcj0iZDQ4ZWI1Y2E5OTQ4NjQxNTIxZWIxNzY5Yjg4MjU2YjUiXSAgPiAudGItZ3JpZC1jb2x1bW46bnRoLW9mLXR5cGUoMW4rMSkgeyBncmlkLWNvbHVtbjogMSB9IC53cHYtdmlldy1vdXRwdXRbZGF0YS10b29sc2V0LXZpZXdzLXZpZXctZWRpdG9yPSJkNDhlYjVjYTk5NDg2NDE1MjFlYjE3NjliODgyNTZiNSJdIC5qcy13cHYtbG9vcC13cmFwcGVyID4gLnRiLWdyaWQgeyBncmlkLXRlbXBsYXRlLWNvbHVtbnM6IG1pbm1heCgwLCAxZnIpO2dyaWQtYXV0by1mbG93OiByb3cgfSAgLnRiLWltYWdle3Bvc2l0aW9uOnJlbGF0aXZlO3RyYW5zaXRpb246dHJhbnNmb3JtIDAuMjVzIGVhc2V9LndwLWJsb2NrLWltYWdlIC50Yi1pbWFnZS5hbGlnbmNlbnRlcnttYXJnaW4tbGVmdDphdXRvO21hcmdpbi1yaWdodDphdXRvfS50Yi1pbWFnZSBpbWd7bWF4LXdpZHRoOjEwMCU7aGVpZ2h0OmF1dG87d2lkdGg6YXV0bzt0cmFuc2l0aW9uOnRyYW5zZm9ybSAwLjI1cyBlYXNlfS50Yi1pbWFnZSAudGItaW1hZ2UtY2FwdGlvbi1maXQtdG8taW1hZ2V7ZGlzcGxheTp0YWJsZX0udGItaW1hZ2UgLnRiLWltYWdlLWNhcHRpb24tZml0LXRvLWltYWdlIC50Yi1pbWFnZS1jYXB0aW9ue2Rpc3BsYXk6dGFibGUtY2FwdGlvbjtjYXB0aW9uLXNpZGU6Ym90dG9tfSAgIH0g